Between sense and nonsense: how much light travels through opaque materials?

Opaque scattering materials, such as paint, foam, and tissue, typically consist of many small particles that cause incident light waves to be scattered and absorbed. Understanding how much light travels through such materials is crucial for many applications ranging from atmospheric and climate sciences, oceanography, biophysics, powder technology, to modern light-emitting diode (LED) lighting. Following Nobel prize winner Subrahmanyan Chandrasekhar, one often uses the so-called radiative transfer equation to predict and understand how much light is transported through a scattering material. Under some circumstances, however, the equation is known to predict nonsense, namely negative energy densities and negative fluxes. But it was not yet clear for which conditions this happens. Therefore, scientists from the University of Twente in the Netherlands recently made a systematical map of the full range where the theory is sensible and where not. Nonsensical predictions arise when the particles are strongly absorbing, or strongly anisotropic, that is when they preferentially scatter light in a certain direction. Moreover, the team also calibrated the precision of the predictions and identified methods of the theory that are sensible in industrially relevant cases such as LEDs.
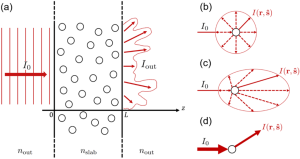
Figure 1: (a) Light waves with intensity are incident on an opaque slab (between 0 and L) full of scattering particles (spheres.) Inside the slab, the light is scattered, resulting in a chaotic outgoing pattern (speckle) with intensity Iout. The refractive index of the slab is nslab and of the surrounding medium nout. Panels (b, c, d) show three examples of scattering particles. (b) An isotropic scatterer scatters in all directions with equal probability. (c) An anisotropic scatterer scatters more light in the forward direction. In (b,c) the solid arrows are incident and scattered light, dashed arrows are other possible scattering directions. The arrow lengths show the probability to scatter into a certain direction. (d) An absorbing scatterer causes a loss of light intensity as depicted by thinner arrows after scattering.
The most popular method to solve the RTE for light is the Monte Carlo simulation of light transport, a statistical method that converges to the exact solution of the RTE. To obtain high accuracy, however, the simulations come at the cost of extremely long computation times, hours, or sometimes even days. Moreover, powerful and expensive computers are needed that consume a lot of electric energy, which hinders applications such as the development of new energy-efficient and sustainable industrial products.
The complexity of the theory and the tedious simulations have stimulated the development of analytical methods (“ready when you press the key”) of the RTE. These methods are sustainable alternatives to Monte Carlo simulations, since press-the-key computations consume fewer resources. In addition, analytical methods are significantly faster, thereby readily allowing new applications. Moreover, for a slab as shown in Fig. 1, the analytical method is as accurate as the tedious simulations. However, in the case of strong absorption and anisotropy, the analytical methods are known to predict nonsense: unphysical negative energy density.
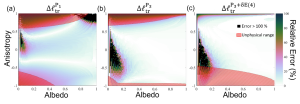
Figure 2: Relative error maps of transport mean free path ltr for (a) the P1, (b) the P3, and (c) the P3+δE(4) approximations. Relative errors are calculated by comparing the approximate theories to exact Monte Carlo simulations. The color map indicates the percentage of errors. Values greater than 100% are shown as black markers. The unphysical ranges of the theories are shown as red hatched regions. This example pertains to typical white LEDs, namely optical thickness b=3 and refractive index contrast Δn2=0.245.
In their recent paper, the Twente team maps out the unphysical ranges of three popular methods to the RTE (called P1, P3, and P3+δE(4)). In addition, they calibrate the errors of all methods. These errors are presented as maps of the errors of the physical properties obtained from measurements while using these theories, see Figure 2.
The new results show that the most widely used P1 method is highly inaccurate unless the sample scatters purely isotropic and elastic. First author Akdemir explains: “The P3 approximation exceeds P1 in terms of accuracy for moderate absorption. The good news for industrial applications is that the P3+δE(4) method is the best (of the three considered) for cases where forward scattering dominates, like white LED lighting or biophysics.”
About the work:
The paper is published online in the leading physics journal Physical Review A, that is published by the American Physical Society (APS).
Phys. Rev. A 105, 033517 (2022)
Open access available at doi: https://doi.org/10.1103/PhysRevA.105.033517
A copy of the paper is available on the COPS website at: https://nano-cops.com/publications/article/breakdown-of-light-transport-models-in-photonic-scattering-slabs-with-strong-absorption-and-anisotropy/
The team:
The work is done by Ozan Akdemir MSc and Profs. Ad Lagendijk and Willem Vos from the Complex Photonic Systems (COPS) chair of the MESA+ Institute for Nanotechnology at the University of Twente in the Netherlands. The work is part of the ongoing NWO-TTW Perspectief program “Free-form Scattering Optics” (FFSO), a collaboration in applied sciences and technology with TU Eindhoven and TU Delft, with active participation of users from leading industries ASML, Lumileds, Signify, TNO, Demcon, Schott.
Further contact
Ozan Akdemir MSc, telephone = 053 – 4898547, email = o.akdemir@utwente.nl
Prof. Willem Vos, telephone = 053 – 4895388 or 053 – 4895390 (secretariat), email = w.l.vos@utwente.nl